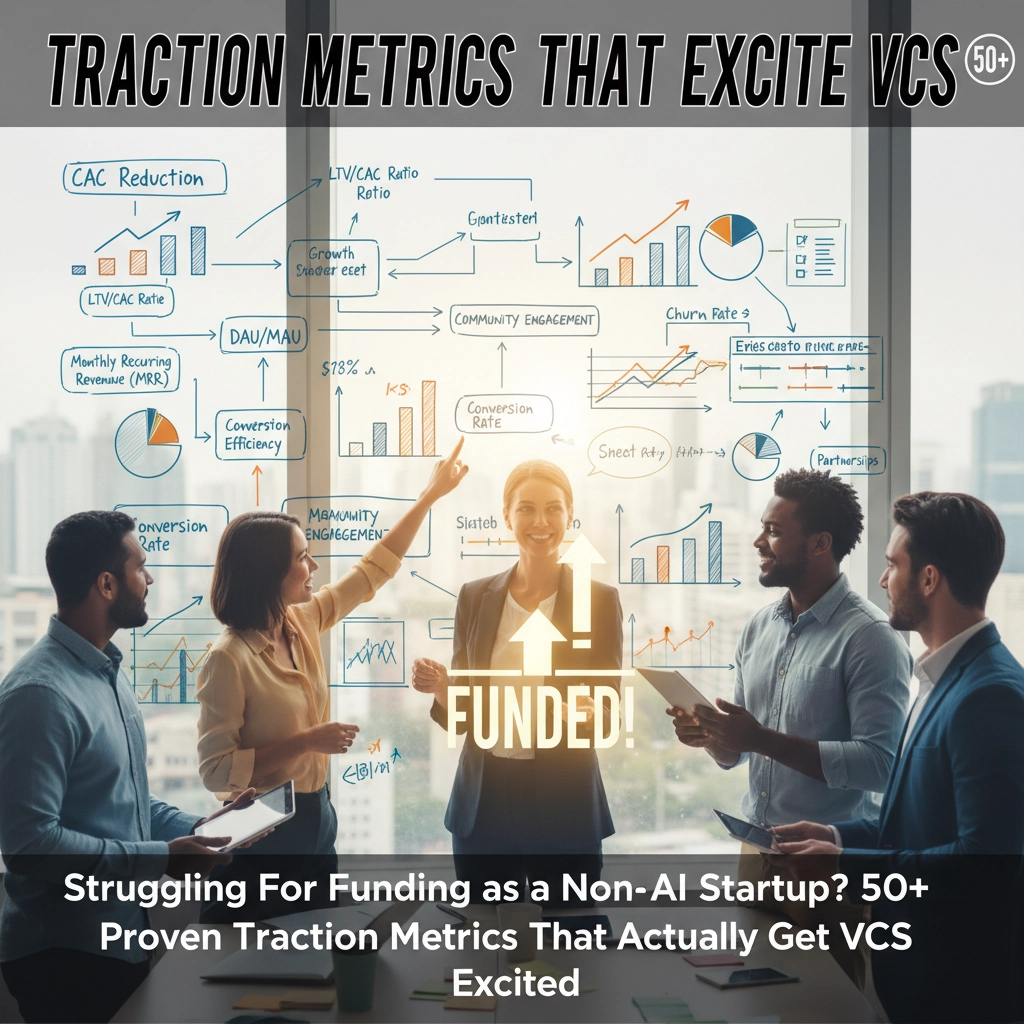
Struggling For Funding as a Non-AI Startup? 50+ Proven Traction Metrics That Actually Get VCs Excited
Let's be real – if you're running a non-AI startup in 2025, fundraising feels like playing the game on hard mode. While AI companies are raising massive rounds left and right, everyone else is facing a brutal reality: longer fundraising timelines, more meetings, and way higher bars for success.
But here's the thing – strong traction metrics still open doors, regardless of whether your startup has "AI" in the pitch deck. VCs invest in numbers, not just narratives. The trick is knowing which metrics actually move the needle and how to present them in a way that gets investors excited.
If you're close to hitting the benchmarks investors want, remember this: three great months can change everything. Focus obsessively on demonstrating acceleration over 90-120 days, and investors will often forgive previous underperformance when they see genuine momentum building.
The Financial Foundation
Your revenue metrics tell the most important story. Revenue Growth Rate isn't just nice to have – it's make or break. Track month-over-month increases religiously. In today's market, showing 12% month-over-month revenue growth or higher signals the kind of acceleration that makes investors pay attention.
For SaaS and subscription businesses, Monthly Recurring Revenue (MRR) and Annual Recurring Revenue (ARR) provide the foundation for everything else. These aren't vanity metrics – they're what investors use to model your future and determine valuation.
Your Burn Rate and Runway have never mattered more. With fundraising timelines stretching and success rates dropping for non-AI companies, showing capital efficiency isn't optional. Investors want to see you can survive until your next major milestone.

Gross Margin reveals your profitability potential. SaaS companies should target 70-80%, while hardware and e-commerce typically run lower. This metric shows investors whether your business model can actually scale profitably.
The Rule of 40 combines growth rate and profit margin (Growth Rate % + Profit Margin %). SaaS companies scoring above 40 demonstrate that sweet spot of efficient growth that VCs love to see.
Customer Economics That Actually Matter
Here's where most founders get tripped up. Customer Acquisition Cost (CAC) measures exactly what you spend to acquire each new customer. Divide total marketing and sales spend by new customers acquired. Simple formula, massive implications.
Customer Lifetime Value (LTV) calculates total revenue a customer generates throughout their relationship with your company. The formula – ARPU × Gross Margin ÷ Churn Rate – reveals whether your business model can actually scale. If LTV falls below CAC, you're losing money on every customer. That's a major red flag.
The LTV:CAC Ratio demonstrates unit economics at a glance. SaaS companies should target 3-5× while B2C businesses should aim for 4-6×. This single number proves you can acquire customers profitably.
Payback Period shows how quickly you recover customer acquisition costs. Shorter payback periods mean faster cash flow and less reliance on external capital – exactly what investors want to see in this market.
Customer Acquisition Cost by Channel breaks down CAC across different marketing and sales channels. Understanding which channels deliver customers most efficiently lets you double down on what works and kill what doesn't.
Growth and Retention Signals
Net Dollar Retention (NDR) measures revenue expansion from existing customers. NDR above 100% means customers are spending more over time through upsells, cross-sells, or usage expansion. This is pure gold for VCs because it shows organic growth potential.
Customer Churn Rate directly impacts everything else. Keep monthly churn below 3% to demonstrate strong product-market fit. High churn suggests fundamental problems that prevent scalable growth.

User Growth Rate tracks how quickly you're expanding your customer base. Consistent growth beats sporadic spikes every time. Investors want sustainable momentum that suggests continued expansion.
For consumer and prosumer products, Daily Active Users (DAU) and Monthly Active Users (MAU) matter tremendously. The DAU/MAU ratio reveals stickiness – higher ratios mean users return frequently instead of churning quickly.
Activation Rate measures what percentage of users complete key actions that indicate they've experienced your core value. High activation rates suggest strong product-market fit and effective onboarding.
Sales and Marketing Efficiency
Marketing Qualified Leads (MQLs) and Sales Qualified Leads (SQLs) track pipeline health for B2B companies. The conversion rate between MQLs and SQLs reveals how well marketing aligns with actual sales opportunities.
Sales Cycle Length measures average time from first contact to closed deal. Shortening sales cycles improves cash flow and reduces cost of revenue generation.
Win Rate calculates what percentage of qualified opportunities convert to paying customers. Improving win rates directly impacts revenue efficiency and validates your value proposition.
Time to Value measures how quickly new customers realize meaningful benefits. Faster time to value correlates with better activation, retention, and expansion.

Product Validation Metrics
Net Promoter Score (NPS) gauges customer satisfaction and likelihood to recommend your product. NPS scores above 50 suggest strong product-market fit and potential for organic growth through word-of-mouth.
Feature Adoption Rate tracks how quickly and broadly customers adopt new capabilities. Strong feature adoption validates your product roadmap and shows you're building what customers actually need.
Product-Market Fit Score can be quantified through customer surveys: "How would you feel if you could no longer use this product?" If more than 40% say "very disappointed," you've likely achieved product-market fit.
The Power User Curve analyzes how many days per month different user cohorts engage with your product. A healthy curve shows significant portions of users engaging frequently – indicating genuine value delivery.
Operational Excellence Indicators
Revenue per Employee demonstrates how productively you utilize human capital. Since labor typically represents the largest expense for most startups, this metric shows operational efficiency.
Cash Conversion Score tracks how effectively you convert revenue into cash. This becomes crucial as you scale and need to fund growth from operations rather than constant fundraising.
Team Efficiency Metrics beyond revenue per employee include customer support tickets resolved per agent, features shipped per engineer, and deals closed per sales rep.
The Differentiation Factor
Here's what most founders miss: you need to be number one at something specific and provable. Generic claims about having a "great team" don't cut it anymore. Show concrete data proving superiority: "We have 10x the accuracy of competitors as measured by [specific metric]" or "We're the fastest-growing solution in [narrow category] with [specific data]."
Comparative Performance Benchmarks position you against competitors in measurable ways. This might include processing speed, accuracy rates, cost efficiency, or any dimension where you demonstrably excel.
Speed of Execution metrics track how quickly you achieve milestones, roll out features, or enter new markets. In a world where AI-native companies set blistering pace expectations, demonstrating rapid execution helps non-AI startups compete for attention.
Market Share in Target Segment demonstrates competitive positioning. Being number one in a specific, well-defined market segment carries more weight than being a small player in a large market.

Stage-Specific Strategy
Your stage significantly influences which metrics matter most. Pre-revenue companies should emphasize user growth, engagement, and qualitative indicators of product-market fit. Early-revenue startups need initial customer validation and improving unit economics. Growth-stage companies must demonstrate scalable, efficient revenue expansion with strong retention.
Pre-traction? Focus on leading indicators: waitlist size, pilot program interest, letters of intent, design partner engagement, or other signals of market demand. These forward-looking metrics help compensate for limited historical data.
The 2025 Reality Check
Non-AI startups need to prepare for 5× more investor meetings than AI counterparts if you're not hitting top quartile growth. Success requires thick skin, persistence, and brutally honest assessment of your actual funding odds before you begin.
The bar keeps rising because VCs compare you against the fastest-growing companies in history – and AI-native companies have redefined what's possible. Your task is either meeting that elevated bar through exceptional metrics or building a great business that doesn't require venture capital.
Run your company as if the next round isn't guaranteed – unless you have greater than 70% confidence. The biggest failure mode is burning through capital while assuming funding is inevitable when it actually isn't.
Strong metrics remain the universal currency of venture capital, regardless of market conditions or technological trends. By tracking, improving, and effectively communicating these traction indicators, non-AI startups can still capture investor attention and secure funding needed to scale. The path may be steeper, but demonstrated traction with genuine momentum continues opening doors.